meta data for this page
Software interface
There are several software interfaces available to monitor the status of the t.RECS® system. These are the Management WebGUI, a Redfish API and a proprietary REST API providing XML based monitoring and management functionality.
Management WebGUI
The Management WebGUI is established on every t.RECS® unit. Accessible by any known browser on the assigned IP address and the default port 80. The following views are dependent on the device and assembly.
In general these symbols have the following meaning on every page:
 | Everything is OK. Also indicated by a green line in a graph. |
 | Warnung. Something is wrong, but the system is still fully functional. The system has to be checked so the problem doesn't get worse. Indicated by a yellow line in a graph. |
 | Critical Error. The system must be checked immediately and maybe has to be shut down to prevent hardware damage. indicated by a red line in a graph. |
On the left side is a menu, which can be toggled by clicking the menu button in the upper left corner of the screen. The menu contains the following items:
Dashboard: General overview of the managed system, installed nodes and health status
Management: Power control and monitoring for all nodes and fans
Network: VLAN-Configuration and of management network
Composition: Configuration of PCIe resources
Users: User management
Settings: System-wide configuration settings
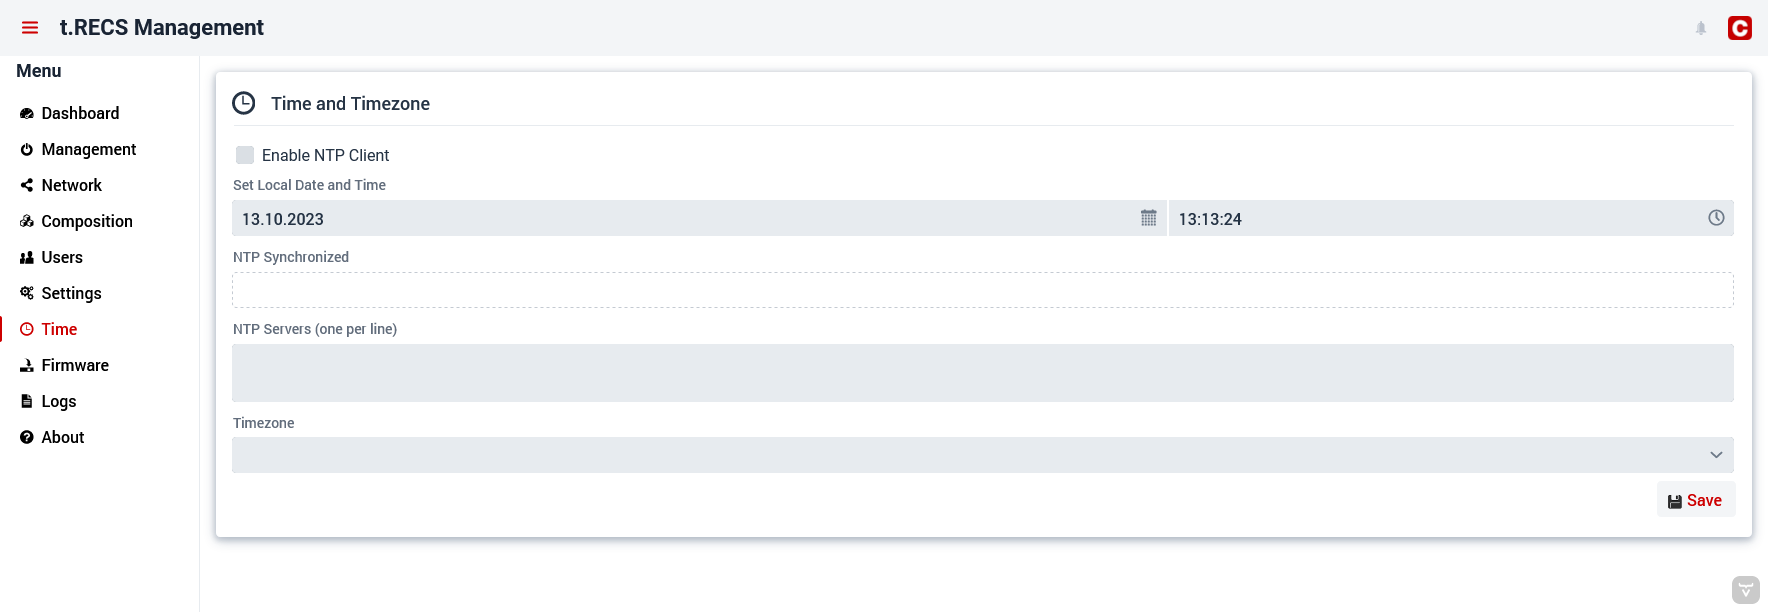
Time: System time settings
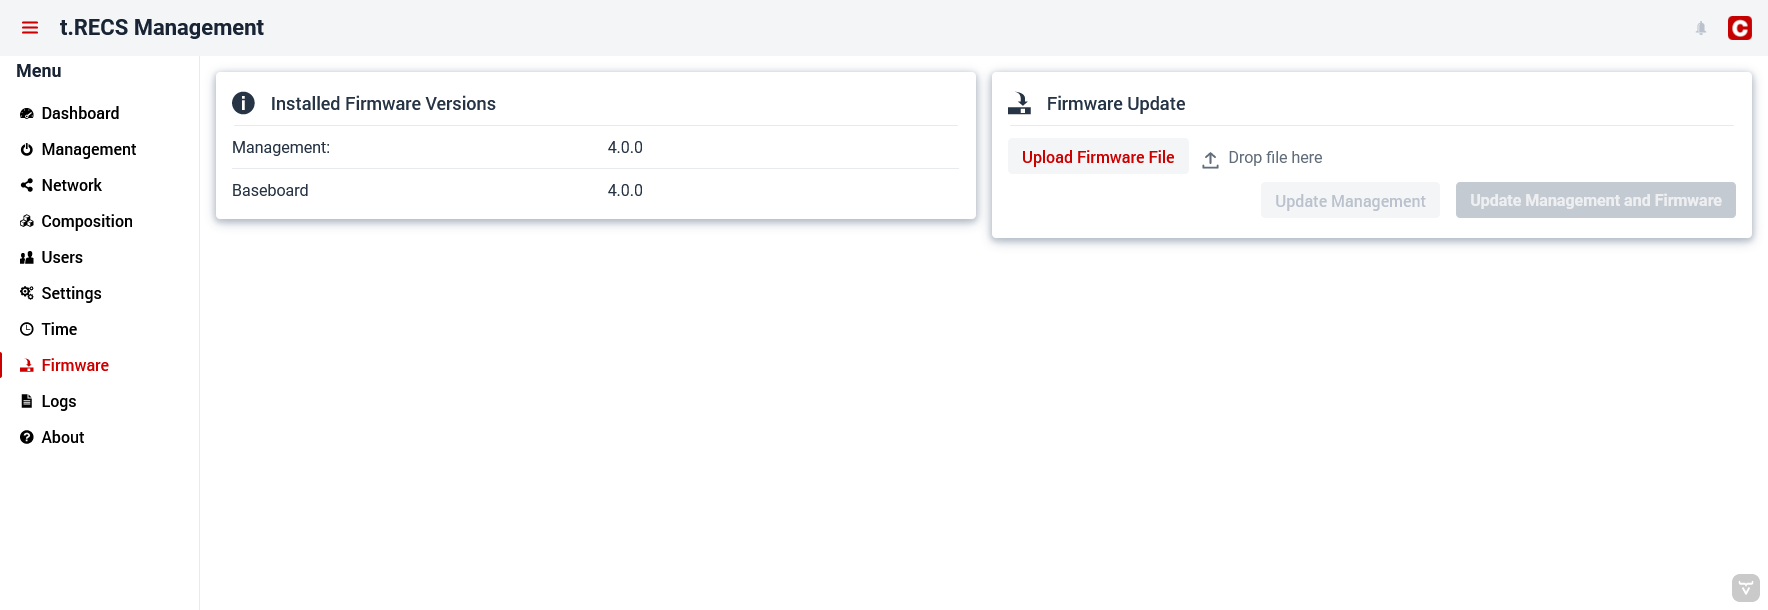
Firmware: Firmware updates and overview of software versions
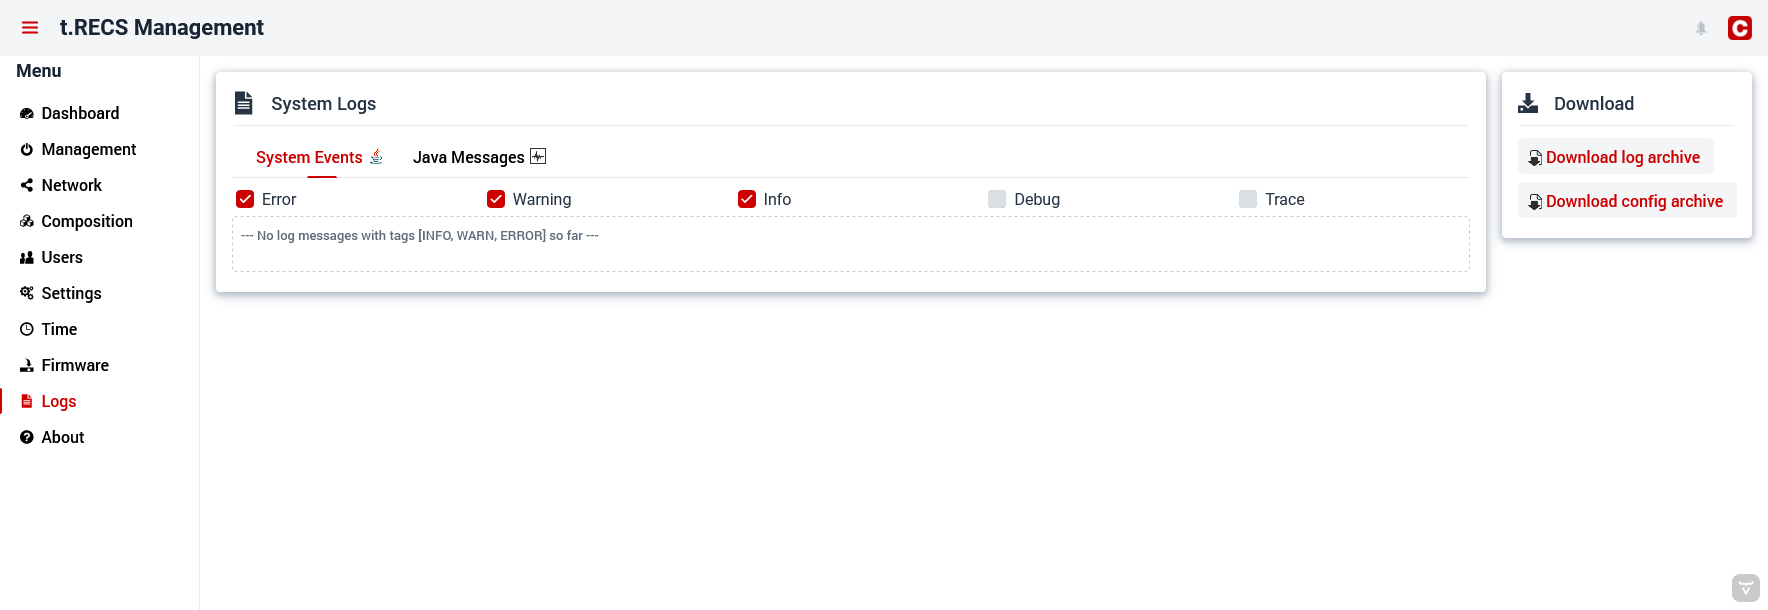
Logs: Logs from the management software about system health and java messages.
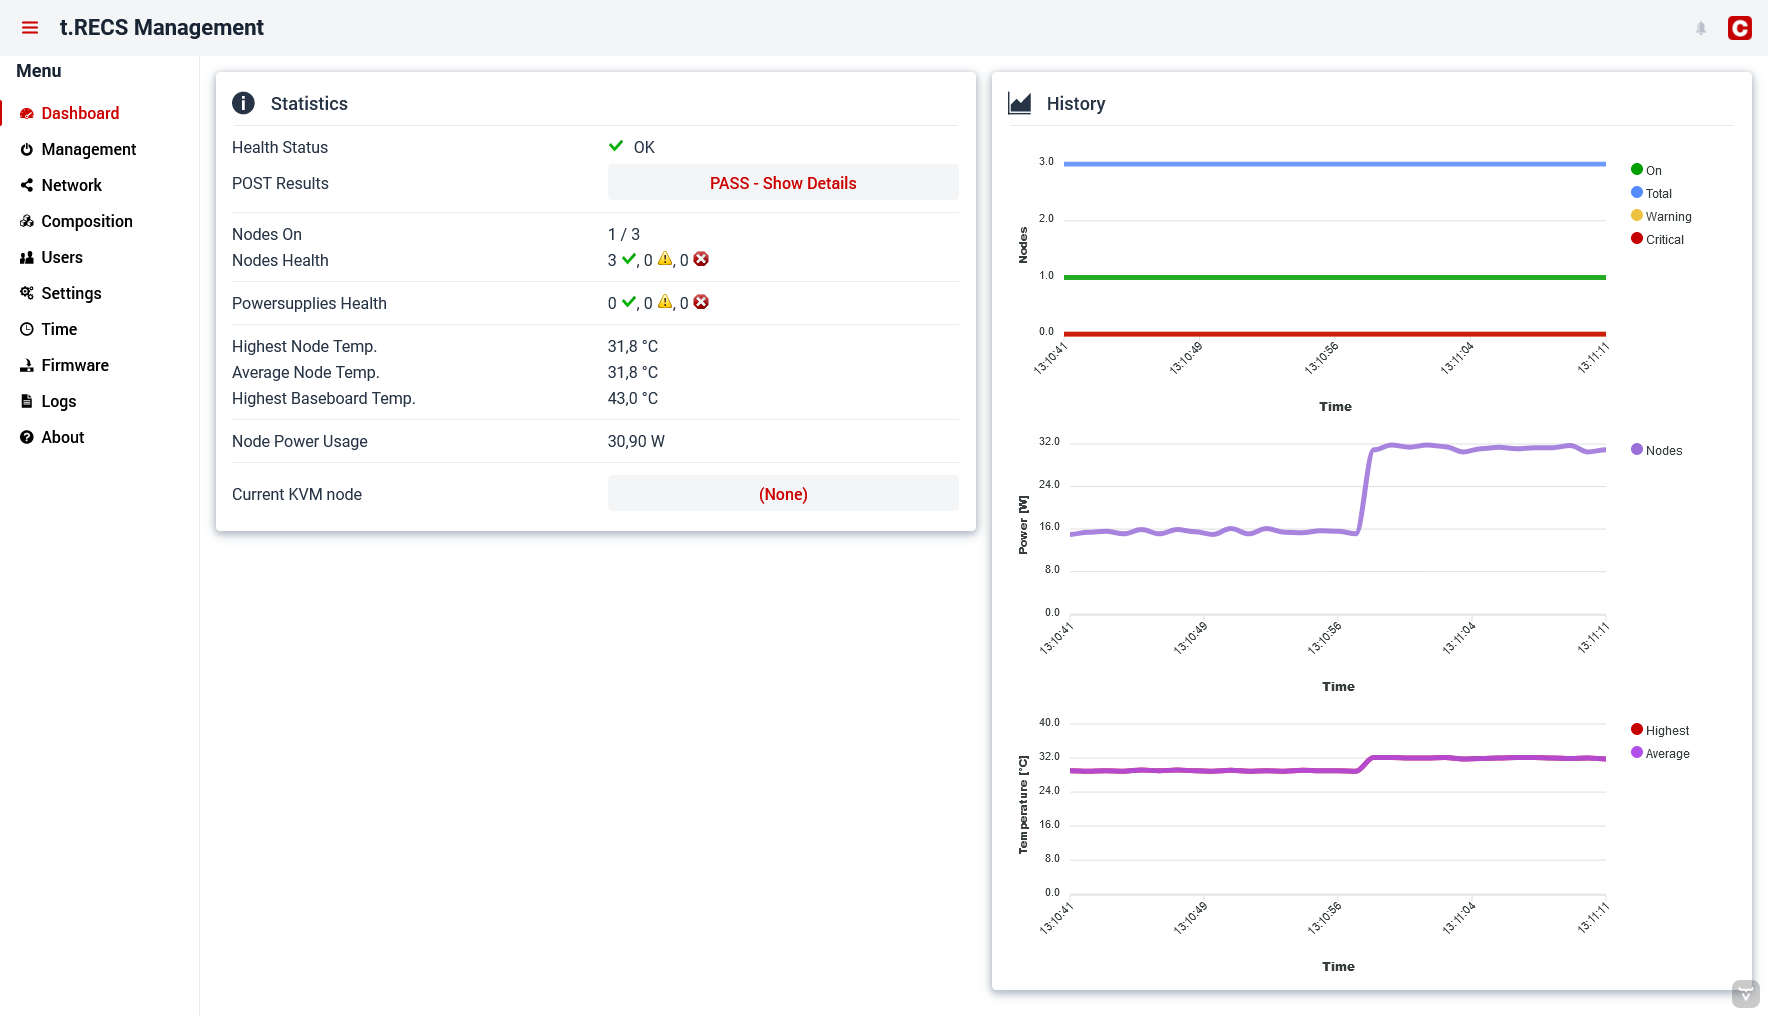
Dashboard
The Dashboard is seen first when opening the WebGUI and displays the summarized system health status.
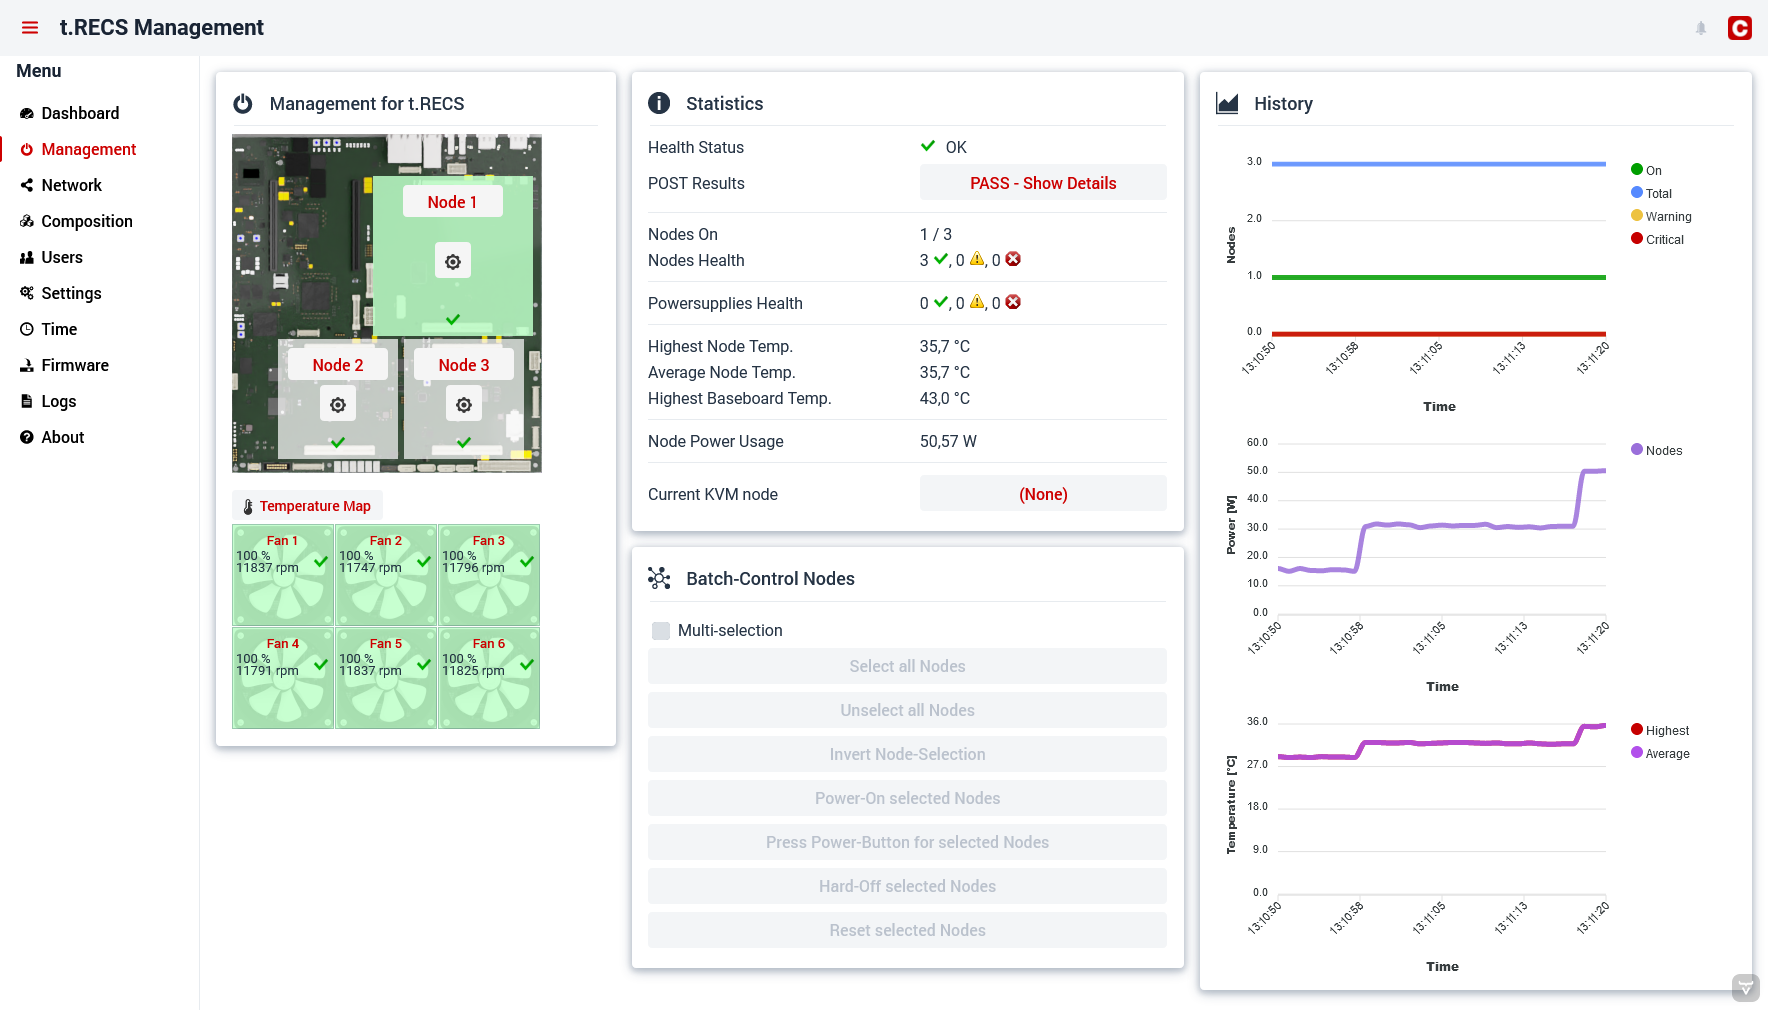
Management
In this view, nodes can be turned on or off with a quick menu, which opens when clicking on the gear symbol of a node.
Multiple nodes can be controled at once via the panel “Batch-Control Nodes”.
The view also shows fan monitoring data and allows a detailed look at the temperature map of the system's baseboard.
By clicking on a node label, the respective Node Management view is opened.
Furthermore the view displays the summarized system health status.
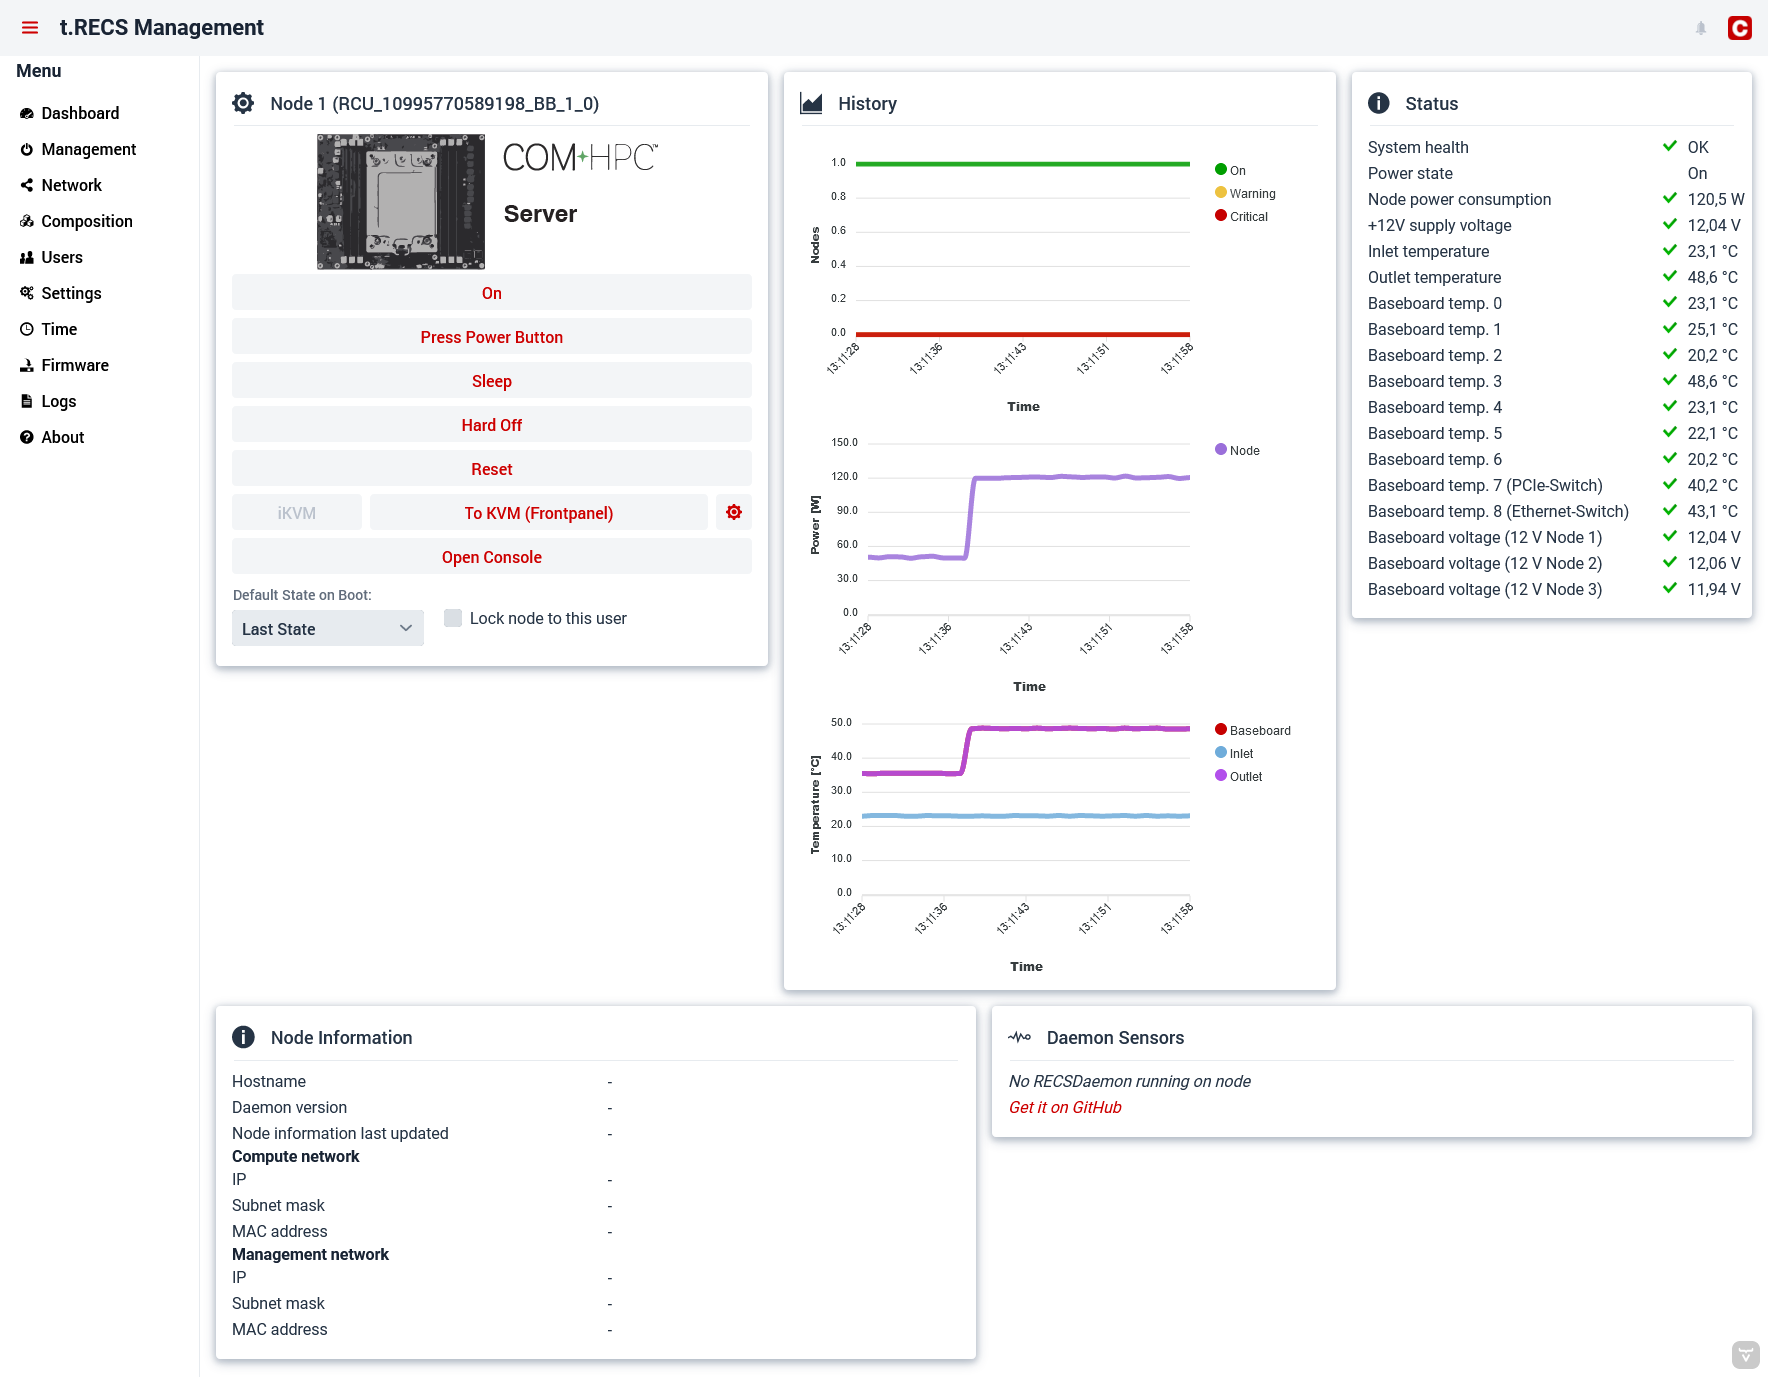
Node Management
This view features controlling the power state of the selected node and monitoring its detailed status values and graphs.
It is also possible to change KVM settings or open a console to the node.
If the node is running and the RECSDeamon is installed on it, even more detailed data is shown.
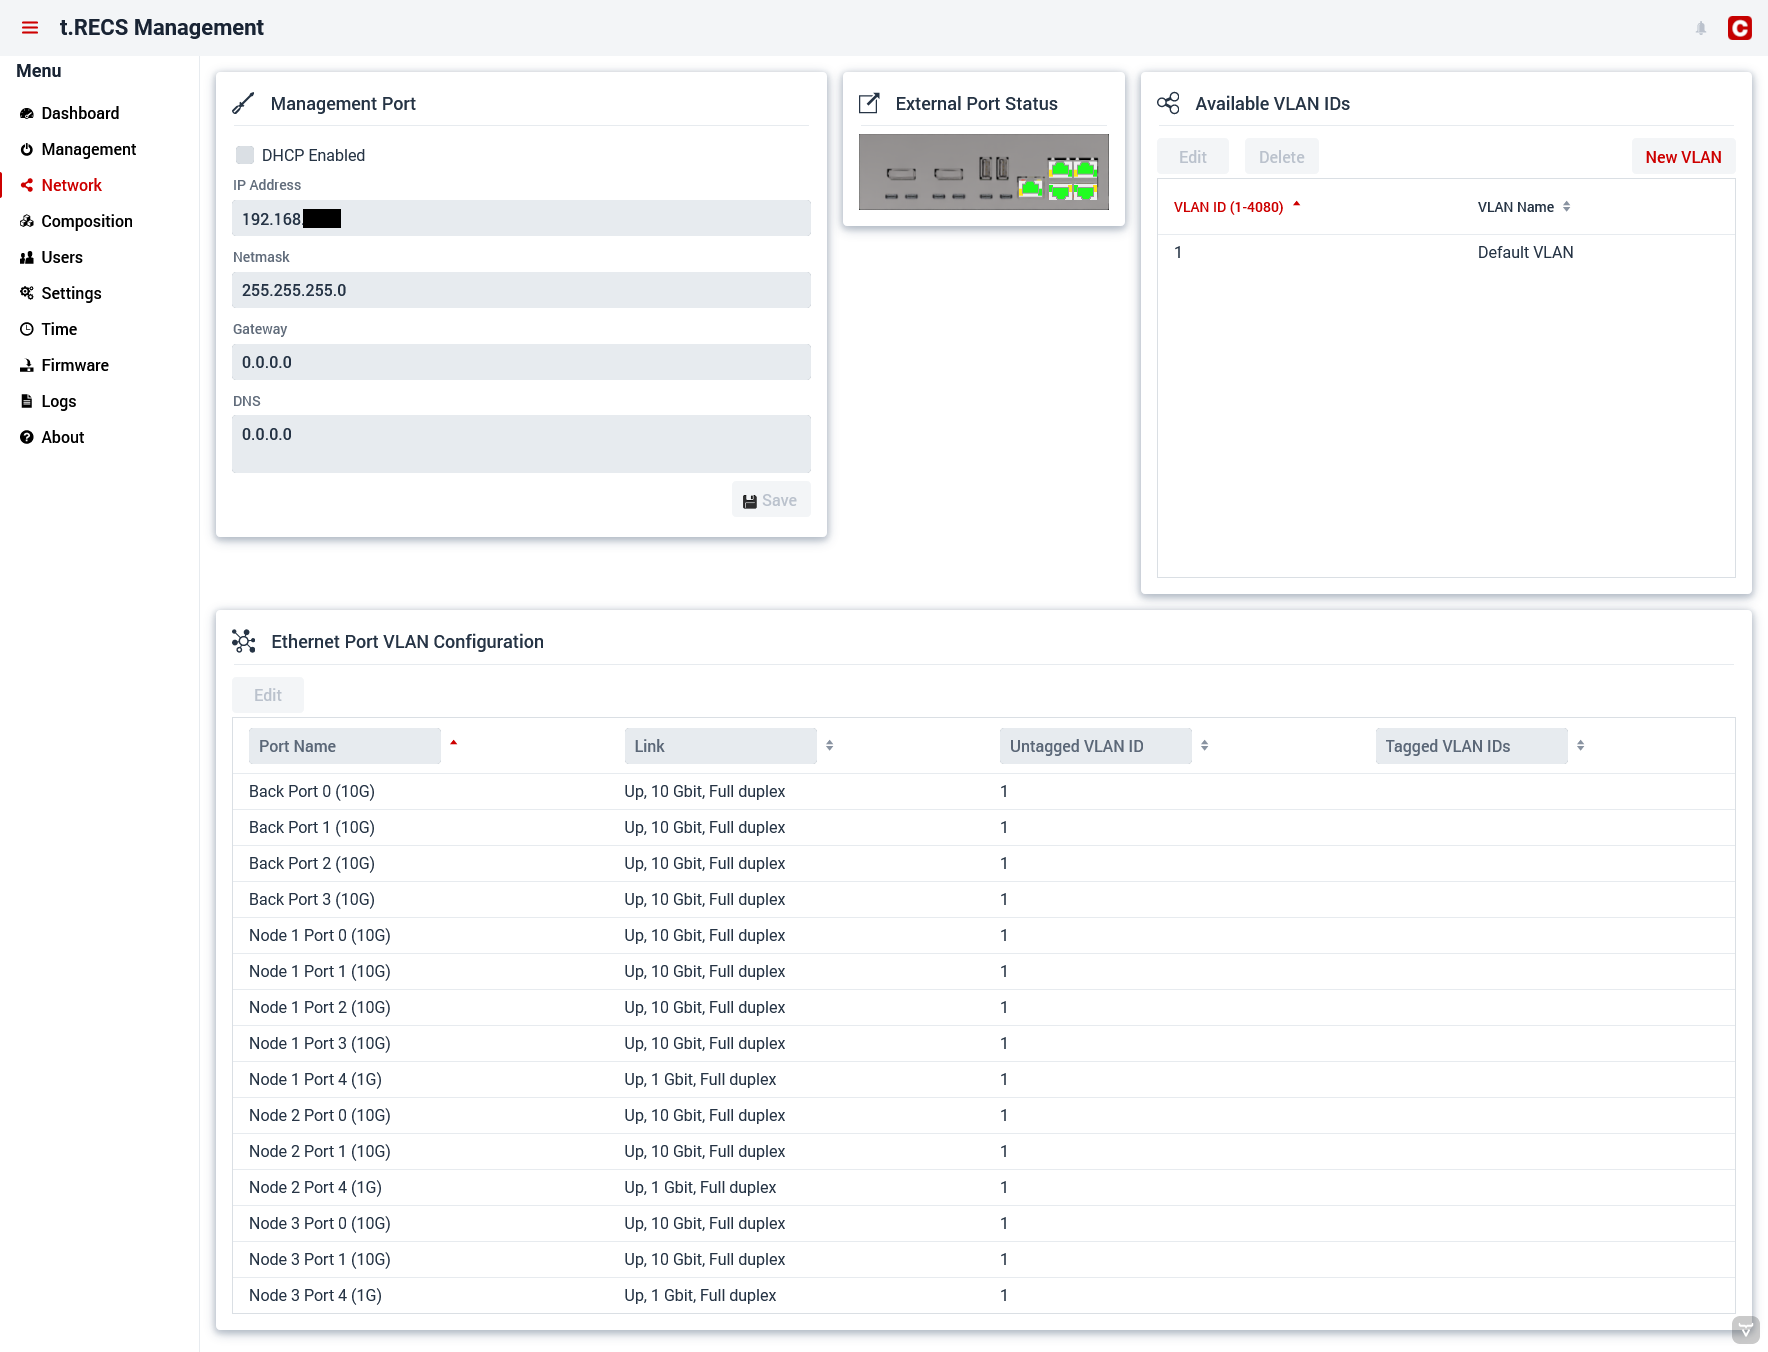
Network
The network view allows changing the settings of the managment port. This port is used to access the webinterface and all APIs.
In addition to that, VLANs of the node network can be configured and assigned to the ports of the nodes and the backpanel.
Composition
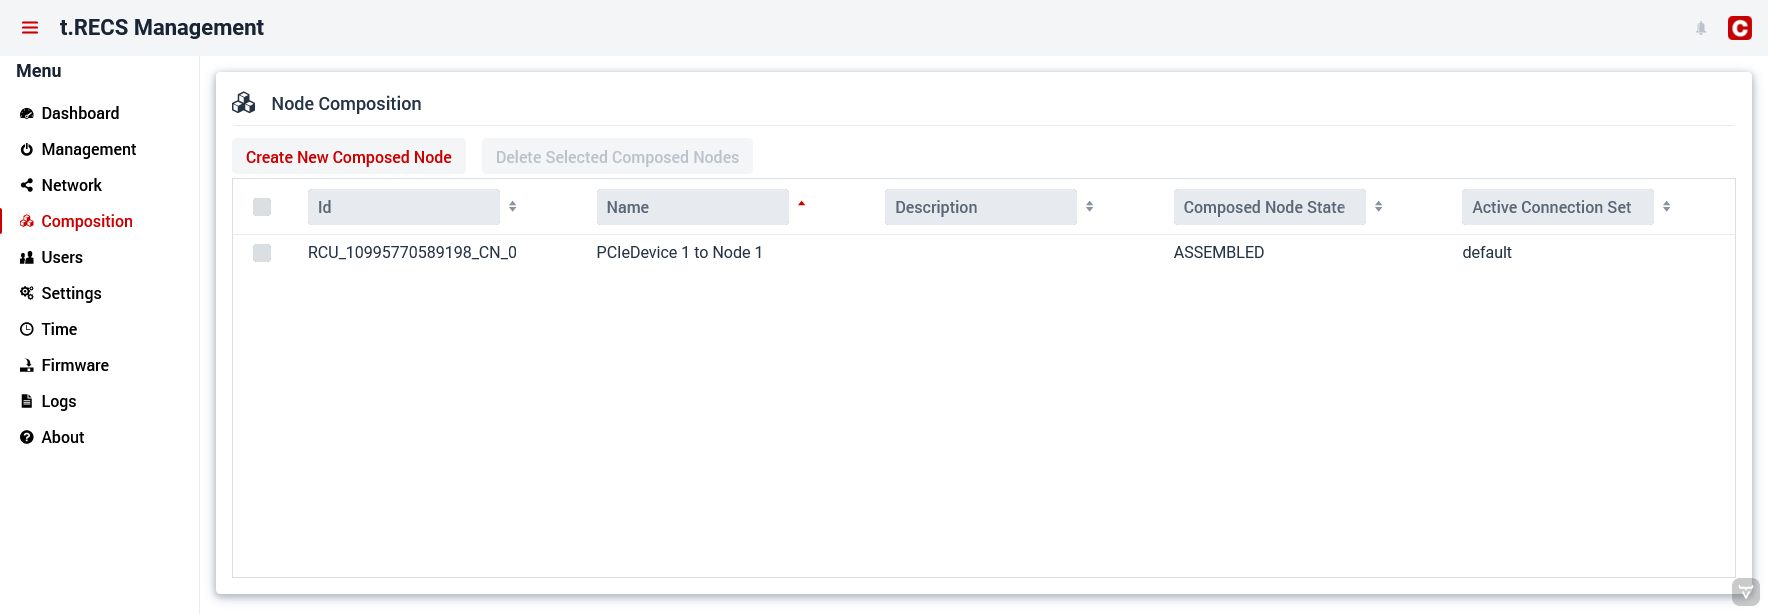
This view allows the configuration of the PCIe resources in the form of composed nodes.
A composed node is a reserved bundle of resources, which utilize PCIe functions.
A wizard leads through the process of creating such composed nodes.
Users
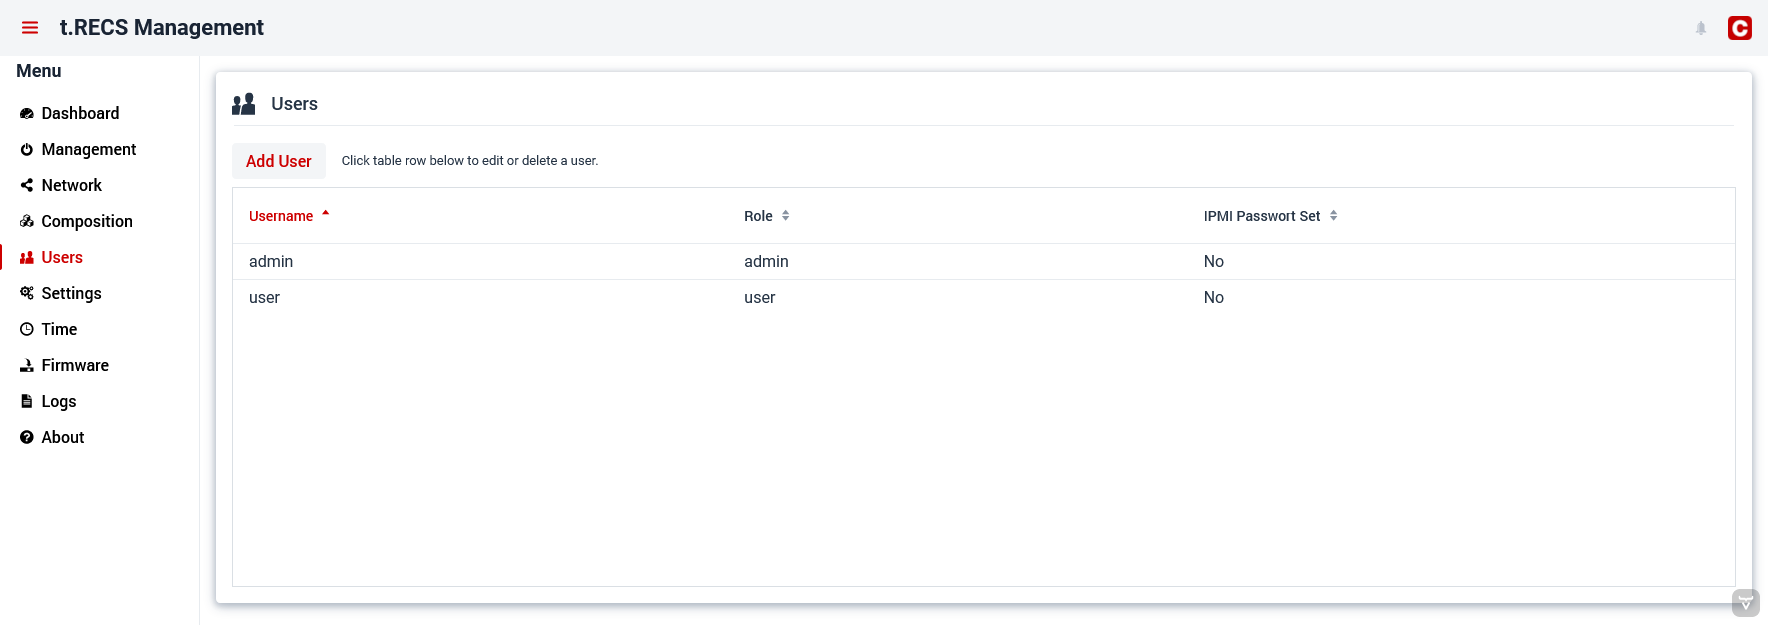
This view features the user management. Users can be created, edited or deleted.
Additionally, IPMI passwords can be set.
Settings
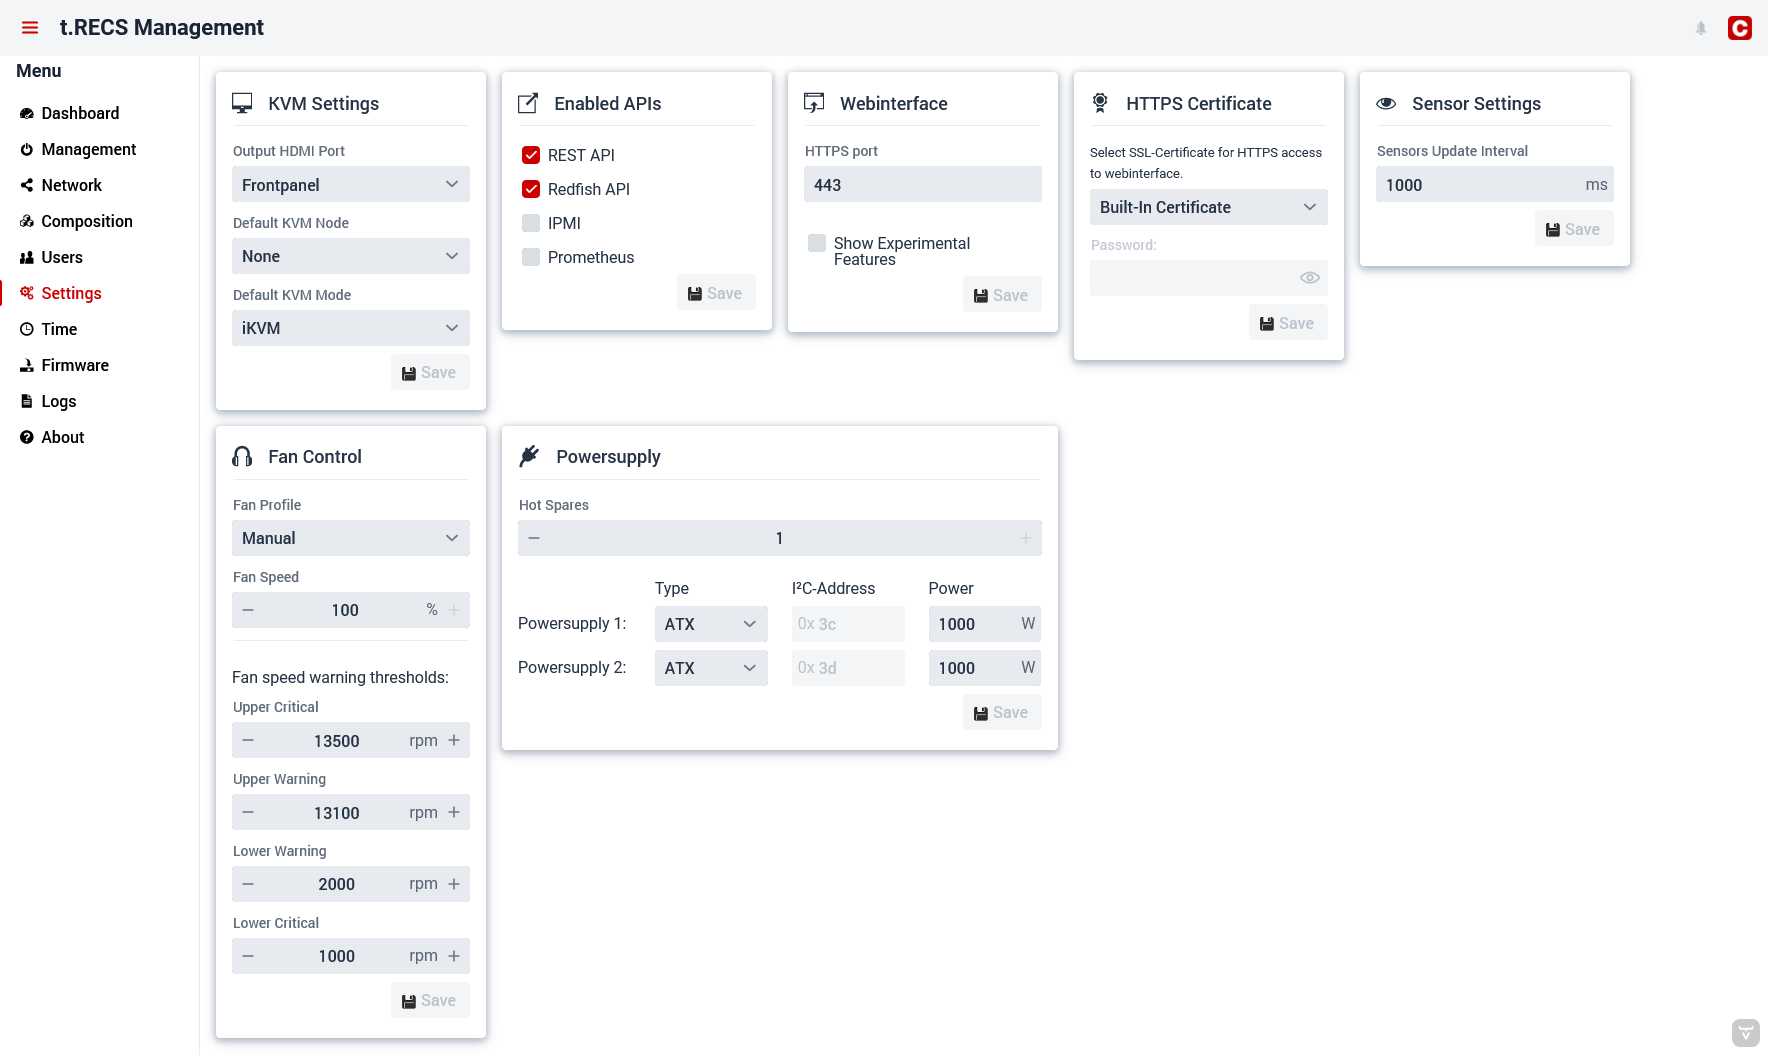
This view allows changing system-wide preferences (e.g. regarding the interfaces of the system).
Time
Firmware
This view shows the currently installed versions of the firmware and management software.
Furthermore, it is possible to update those software components.
Logs
In the System Events tab of this view, the status changes of the sensors, fan and boards can be seen.
In the Java Messages tab , all messages regarding the software can be found.
Several filters can be set for both tabs at the top.
The whole log can be downloaded as a ZIP file containing the individual logfiles.
Redfish API
The management software also features a Redfish API.
The documentation can be seen at Github.
REST API
Access
The REST API is accessible via the management IP-Address or the hostname of the system. The basic URL of the API has the format https://host/REST/.
Accessing the REST API requires HTTP Basic authentication. The authenticated user has to be in the “Admin” or “User” group to be able to execute the POST/PUT management calls.
Components
The REST API makes all hardware components in the cluster available as XML trees in software. The following components are supported by the API:
| Attribute | Description |
|---|---|
rcu | A RECS Computing Unit (RCU) represents the overall system |
baseboard | A baseboard can be equipped with zero or more nodes |
node | A single node |
RCU
The main entrypoint of this API is the RECS Computing Unit (RCU).
Request:
curl -X GET -k -i https://host/REST/rcu
Response:
<rcu name="RCUMaster (192.168.XX.YY)" fanSpeed="100" fanProfile="Manual" health="OK" ip="192.168.XX.YY" kvmNode="RCU_10995770589198_BB_1_0" lastSensorUpdate="1700812747947" type="t.RECS" id="RCU_10995770589198">
  <temperature>
    <sensor name="Node average temperature" unit="°C" health="OK">35.60748455616409</sensor>
    <sensor name="Node highest temperature" unit="°C" health="OK">35.60748455616409</sensor>
    <sensor name="RCU infrastructure highest temperature" unit="°C" health="OK">43.02157752743136</sensor>
  </temperature>
  <baseboard>RCU_10995770589198_BB_1</baseboard>
  <fan>RCU_10995770589198_Fan_TRECS_1</fan>
  <fan>RCU_10995770589198_Fan_TRECS_2</fan>
  <fan>RCU_10995770589198_Fan_TRECS_3</fan>
  <fan>RCU_10995770589198_Fan_TRECS_4</fan>
  <fan>RCU_10995770589198_Fan_TRECS_5</fan>
  <fan>RCU_10995770589198_Fan_TRECS_6</fan>
  <node>RCU_10995770589198_BB_1_0</node>
  <node>RCU_10995770589198_BB_1_1</node>
  <node>RCU_10995770589198_BB_1_2</node>
  <power>
    <sensor name="RCU total power usage" unit="W" health="OK">50.67613209098747</sensor>
    <sensor name="RCU infrastructure power usage" unit="W" health="OK">0.0</sensor>
    <sensor name="RCU power usage (Node)" unit="W" health="OK">50.67613209098747</sensor>
  </power>
</rcu>
Attributes:
| Attribute | Description | Unit | Data type |
|---|---|---|---|
name | Name of the RCU | - | String |
fanSpeed | Current speed setting of the fans in the RCU | % | Integer |
fanProfile | Current fan profileof the RCU | % | Integer |
health | Health status of the RCU (OK, Warning, Critical) | - | String |
ip | IP address of the RCU | - | String |
kvmNode | ID of the node to which the KVM system is switched (optional) | - | String |
lastSensorUpdate | Timestamp of the last sensor update | ms | Long |
type | Type of the RCU | - | String |
id | ID for referencing the component | - | String |
Nested elements:
| Element | Description | Unit | Data type |
|---|---|---|---|
temperature | List of temperature sensors | °C | Double |
baseboard | ID of the baseboard which is installed in the RCU | - | String |
fan | IDs of fans, which are installed in the RCU | - | String |
node | IDs of nodes, which are installed in the RCU | - | String |
power | List of power sensors | W | Double |
Baseboard
Request:
curl -X GET -k -i https://host/REST/baseboard/RCU_10995770589198_BB_1
Response:
<baseboard type="t.RECS" expansionBoardInserted="false" health="OK" lastSensorUpdate="1700825809191" rcuPosition="1" id="RCU_10995770589198_BB_1">
  <fan>RCU_10995770589198_Fan_TRECS_1</fan>
  <fan>RCU_10995770589198_Fan_TRECS_2</fan>
  <fan>RCU_10995770589198_Fan_TRECS_3</fan>
  <fan>RCU_10995770589198_Fan_TRECS_4</fan>
  <fan>RCU_10995770589198_Fan_TRECS_5</fan>
  <fan>RCU_10995770589198_Fan_TRECS_6</fan>
  <node>RCU_10995770589198_BB_1_0</node>
  <node>RCU_10995770589198_BB_1_1</node>
  <node>RCU_10995770589198_BB_1_2</node>
  <power>
    <sensor name="Baseboard infrastructure power" unit="W" health="OK">0,00</sensor>
    <sensor name="Baseboard power usage (Node + PEG)" unit="W" health="OK">120.57697622394205</sensor>
    <sensor name="Baseboard power usage (Node)" unit="W" health="OK">120.57697622394205</sensor>
  </power>
  <temperature>
    <sensor name="Baseboard temp. 0" unit="°C" health="OK">23,0</sensor>
    <sensor name="Baseboard temp. 1" unit="°C" health="OK">25,1</sensor>
    <sensor name="Baseboard temp. 2" unit="°C" health="OK">20,0</sensor>
    <sensor name="Baseboard temp. 3" unit="°C" health="OK">48,8</sensor>
    <sensor name="Baseboard temp. 4" unit="°C" health="OK">23,0</sensor>
    <sensor name="Baseboard temp. 5" unit="°C" health="OK">22,2</sensor>
    <sensor name="Baseboard temp. 6" unit="°C" health="OK">20,0</sensor>
    <sensor name="Baseboard temp. 7 (PCIe-Switch)" unit="°C" health="OK">40,2</sensor>
    <sensor name="Baseboard temp. 8 (Ethernet-Switch)" unit="°C" health="OK">43,1</sensor>
  </temperature>
  <voltage>
    <sensor name="Baseboard voltage (12 V Node 1)" unit="V" health="OK">12,05</sensor>
    <sensor name="Baseboard voltage (12 V Node 2)" unit="V" health="OK">12,14</sensor>
    <sensor name="Baseboard voltage (12 V Node 3)" unit="V" health="OK">12,12</sensor>
  </voltage>
</baseboard>
Attributes:
| Attribute | Description | Unit | Data type |
|---|---|---|---|
type | Type of the baseboard | - | String |
expansionBoardInserted | Indicates, if an expansion board is available | - | Boolean |
health | Health status of the baseboard (OK, Warning, Critical) | - | String |
lastSensorUpdate | Timestamp of the last sensor update | ms | Long |
rcuPosition | Position of the baseboard inside the RCU | - | Integer |
id | ID for referencing the component | - | String |
Nested elements:
| Element | Description | Unit | Data type |
|---|---|---|---|
fan | IDs of fans, which are associated to the baseboard | - | String |
node | IDs of nodes, which are installed on the baseboard | - | String |
power | List of power sensors | W | |
temperature | List of temperature sensors | °C | Double |
voltage | List of voltage sensors | V | Double |
Node
Request:
curl -X GET -k -i https://host/REST/node/RCU_10995770589198_BB_1_0
Response:
<node baseboardPosition="0" health="OK" lastSensorUpdate="1700825860193" name="Node 1" type="COM-HPC Server" maxPowerUsage="44" powerState="On" id="RCU_10995770589198_BB_1_0">
  <baseboard>RCU_10995770589198_BB_1</baseboard>
  <deamon/>
  <power>
    <sensor name="Overall Node 1 power" unit="W" health="OK">121.1986045856893</sensor>
    <sensor name="Node 1 power" unit="W" health="OK">121,2</sensor>
  </power>
  <processor instructionSet="x86-64" architecture="x86" type="CPU" cores="4" threads="8" maxSpeedMHz="2800" manufacturer="Intel" model="Xeon E3-1505M v5" />
  <temperature>
    <sensor name="Node 1 inlet temperature" unit="°C" health="OK">23.0416142616874</sensor>
    <sensor name="Node 1 outlet temperature" unit="°C" health="OK">48.733755007535635</sensor>
  </temperature>
  <voltage>
    <sensor name="Baseboard voltage (12 V Node 1)" unit="V" health="OK">12,09</sensor>
  </voltage>
</node>
Attributes:
| Attribute | Description | Unit | Data type |
|---|---|---|---|
baseboardPosition | Position of the node on the baseboard | - | Integer |
health | Health status of the node (OK, Warning, Critical) | - | String |
lastSensorUpdate | Timestamp of the last sensor update | ms | Long |
name | Name of the node | - | String |
type | Type of the node | - | String |
maxPowerUsage | Maximum power the node can draw | W | Integer |
powerState | Power state of the node (Off, On, Soft-off, Standby, Hibernate) | - | String |
id | ID for referencing the component | - | String |
macAddressCompute | MAC address of the NIC connected to the compute network (optional) | - | String |
macAddressMgmt | MAC address of the NIC connected to the management network (optional) | - | String |
Nested elements:
| Element | Description | Unit | Data type |
|---|---|---|---|
baseboard | ID of the baseboard hosting the node | - | String |
deamon | List of deamon sensors (optional) | - | Mixed |
power | List of power sensors | W | Double |
processor | List of processors of this node with detailed information | - | - |
temperature | List of temperature sensors | °C | Double |
voltage | List of voltage sensors | V | Double |
The API offers nodeList, which returns a list of the IDs of all nodes within the system.
Request:
curl -X GET -k -i https://host/REST/node
Response:
<nodeList>
  <node>RCU_10995770589198_BB_1_0</node>
  <node>RCU_10995770589198_BB_1_1</node>
  <node>RCU_10995770589198_BB_1_2</node>
</nodeList>
Fan
Request:
curl -X GET -k -i https://host/REST/fan/RCU_10995770589198_Fan_TRECS_1
Response:
<fan position="TRECS_1" installed="true" nominalSpeed="100" rpm="11766" health="OK" lastSensorUpdate="0" id="RCU_10995770589198_Fan_TRECS_1" />
Attributes:
| Attribute | Description | Unit | Data type |
|---|---|---|---|
position | Position of the fan | - | String |
installed | Indicates, if the fan is installed | - | Boolean |
nominalSpeed | Nominal speed of the fan | % | Integer |
rpm | Actual rotational speed of the fan | rpm | Integer |
health | Health status of the fan (OK, Warning, Critical) | - | String |
lastSensorUpdate | Timestamp of the last sensor update | ms | Long |
id | ID for referencing the component | - | String |
The API offers fanList, which returns a list of the IDs of all fans within the system.
Request:
curl -X GET -k -i https://host/REST/fan
Response:
<fanList>
  <fan>RCU_10995770589198_Fan_TRECS_1</fan>
  <fan>RCU_10995770589198_Fan_TRECS_2</fan>
  <fan>RCU_10995770589198_Fan_TRECS_3</fan>
  <fan>RCU_10995770589198_Fan_TRECS_4</fan>
  <fan>RCU_10995770589198_Fan_TRECS_5</fan>
  <fan>RCU_10995770589198_Fan_TRECS_6</fan>
</fanList>
Endpoints
The resources are split into monitoring resources (for pure information gathering) and management resources (for changing the system configuration or state).
Monitoring
For monitoring the following resources are available:
| Attribute | Description | HTTP Method |
|---|---|---|
/rcu | Returns information about the RCU | GET |
/baseboard | Returns a baseboardList with all baseboard IDs of the RCU | GET |
/baseboard/{baseboard_id} | Returns information about the baseboard with the given ID | GET |
/baseboard/{baseboard_id}/node | Returns a nodeList with all node IDs that are installed on the baseboard with the given ID | GET |
/node | Returns a nodeList with all node IDs of the RCU | GET |
/node/{node_id} | Returns information about the node with the given ID | GET |
/fan | Returns a fanList with all fan IDs of the RCU | GET |
/fan/{fan_id} | Returns information about the fan with the given ID | GET |
Management
The management of individual components can be found under the “manage” path of the component.
| Attribute | Description | HTTP method | Parameter |
|---|---|---|---|
/node/{node_id}/manage/power_on | Turns on the node with the given ID and returns updated node | POST | |
/node/{node_id}/manage/power_button | Turns on/off the node with the given ID and returns updated node | POST | |
/node/{node_id}/manage/power_off | Turns off the node with the given ID and returns updated node | POST | |
/node/{node_id}/manage/reset | Resets the node with the given ID and returns updated node | POST | |
/node/{node_id}/manage/sleep | Sets the node with the given ID in sleep condition and returns updated node | POST | |
/node/{node_id}/manage/select_kvm | Switches the KVM port of the RCU to the node with the given ID and returns updated node | PUT | |
/node/{node_id}/manage/set_bootsource | Sets the boot source of the node with the given ID and returns updated node | PUT | source={NONE,HDD,CD,PXE,USBSTICK},persistent={true,false} |
/rcu/manage/set_fans | Sets the overall fan speed of the RCU and returns the current status of the RCU | PUT | percent={value} |
/rcu/manage/set_fan_profile | Sets the fan profile of the RCU and returns the current status of the RCU | PUT | profile={manual,auto} |
/fan/{fan_id} | Sets the speed of the fan with the given ID and returns the current status of the fan | PUT | percent={value} |
Errors
Information about the success or failure of management requests are returned via HTTP status codes. Please have a look at RFC2616 for an overview about the defined HTTP status codes.
Prometheus
A prometheus exporter is built-in and can be enabled. It is accessable at https://host/metrics/ or http://host/metrics/ and needs a http basic authentication.
The big advantage of the Prometheus exporter compared to other APIs is that it dynamically exports its own metrics and thus, additional metrics can be added or removed during runtime after changing or hotplugging hardware. This allows to export only metrics of those microservers that are plugged in. As the RECS has a modular approach and every RECS can be equipped with different carrier blades and microserver configurations, this approach is of high relevance. Using traditional monitoring tools that don’t support the export of dynamic metrics needs regular manual changes of the configuration files which is annoying.
Prometheus Configuration
Prometheus needs very little configuration to automatically parse all information and write it into a database. This makes all metrics easily accessible.
  - job_name: 'RECS_Master'
    scrape_interval: 1s
    scrape_timeout: 1s
    static_configs:
     - targets: ['192.168.0.100']
    basic_auth:
      username: 'user'
      password: 'password'
Grafana Dashboard
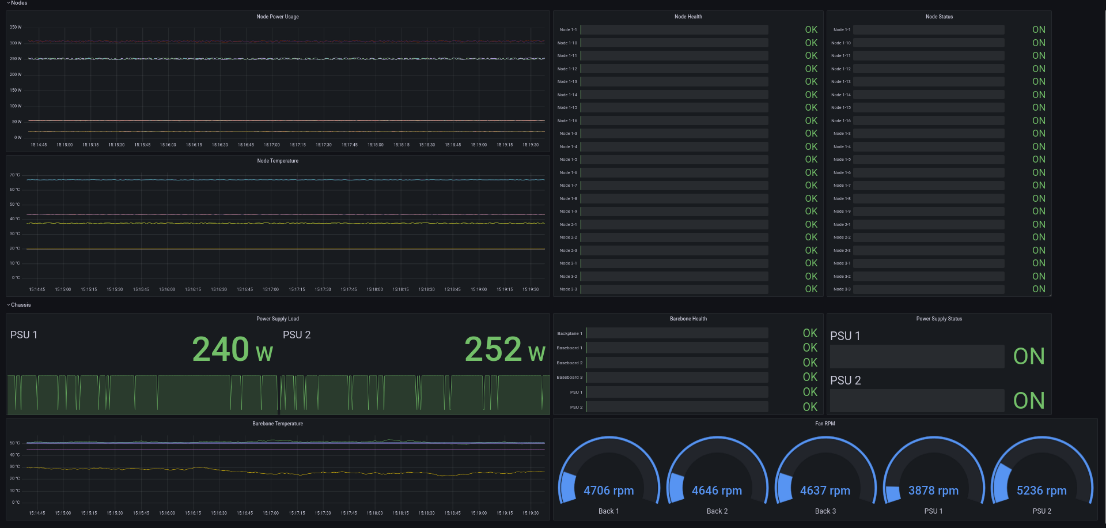
It is recommended to use Grafana as a graphical dashboard to read out these captured metrics. A pre-build Grafana dashboard is publicly available at https://grafana.com/grafana/dashboards/14622. It can be integrated in Grafana using the “Import” function. It automatically reads the available metrics from the database and dynamically adapts to the number of available microservers, see the following picture:


